Creating and interpreting a PSCodeHealth HTML report
By default, Invoke-PSCodeHealth outputs information on the quality and maintainability of the analyzed code in the form of a PSCodeHealth.Overall.HealthReport object.
If you want an "at-a-glance" view to know which area of your code you should focus on, or if you want to share this information with others, Invoke-PSCodeHealth can output a dashboard-like HTML report.
This HTML report is in the form of a single HTML file, so that it can be easily shared via email or any other means. There is a caveat though, it requires internet access when opening the HTML file to download some CSS and Javascript for Bootstrap, jQuery and Chart.js.
Creating an HTML report
To output the PSCodeHealth report as an HTML file, use the HtmlReportPath parameter to specify the full path of the HTML file :
PS C:\> Invoke-PSCodeHealth .\coveralls .\coveralls -HtmlReportPath .\HealthReport.html
The above command will not output anything to the PowerShell pipeline. To generate an HTML report and output a PSCodeHealth.Overall.HealthReport object, add the PassThru parameter, like so :
PS C:\> Invoke-PSCodeHealth .\coveralls .\coveralls -HtmlReportPath .\HealthReport.html -PassThru

Files    Functions       LOC (Average)   Findings        Findings        Complexity     Test Coverage
                                         (Total)         (Average)       (Average)
-----    ---------       -------------   --------------- --------------- -------------- -------------
3        9               22.67           4               0.44            2              39.6 %
This creates a file named HealthReport.html in the current directory. You can just double-click this file to open it in your default browser.
Interpreting the HTML report
When the page first loads, it displays the Summary tab, which looks like this :
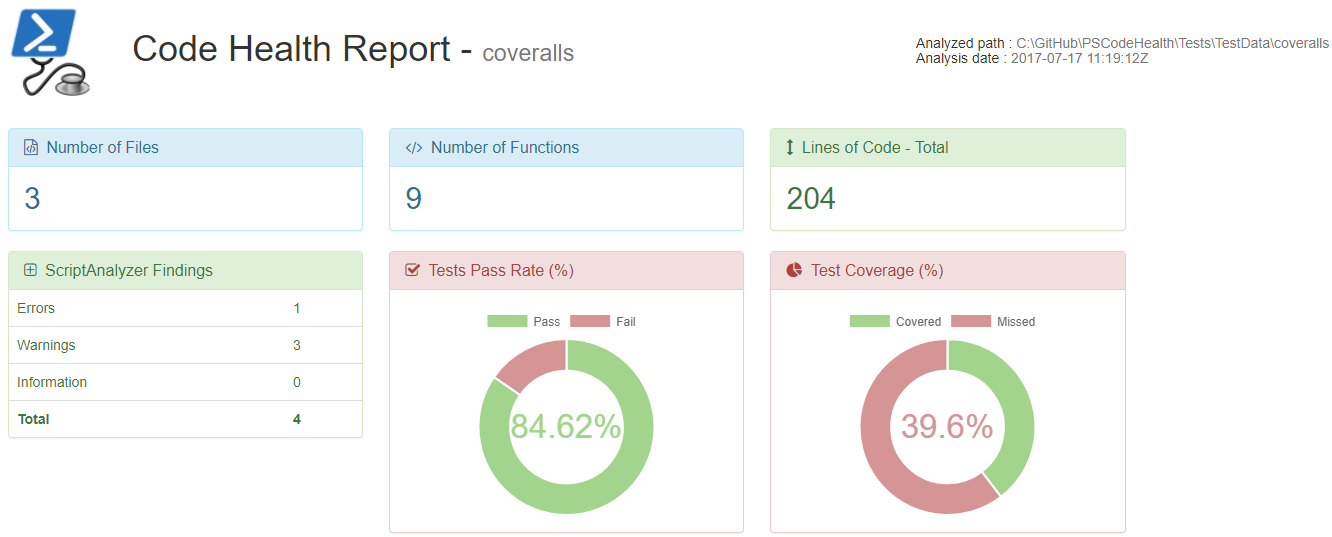
The panels for metrics which have a compliance rule are colored according to their compliance result.
For example, we can see above that the "Lines of Code - Total" panel is green, because the analyzed code is passing the rule for the LinesOfCodeTotal metric.
Similarly, the "Test Coverage (%)" panel is red because the analyzed code is failing the rule for the TestCoverage metric. If a panel is colored yellow, this indicates a warning and a blue panel is just informational, it doesn't have any compliance rule.
This color-coding is designed to quickly draw the viewer's attention to any domain/area of the code which needs attention or improvment.
The Summary tab is just an overview. You can drill down into more specific sections of the report by clicking the links in the sidebar on the left :
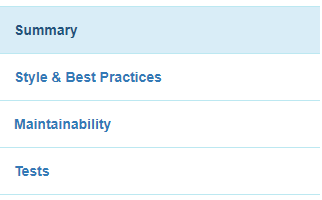
Clicking the Style & Best Practices link will show the Best Practices section of the report :
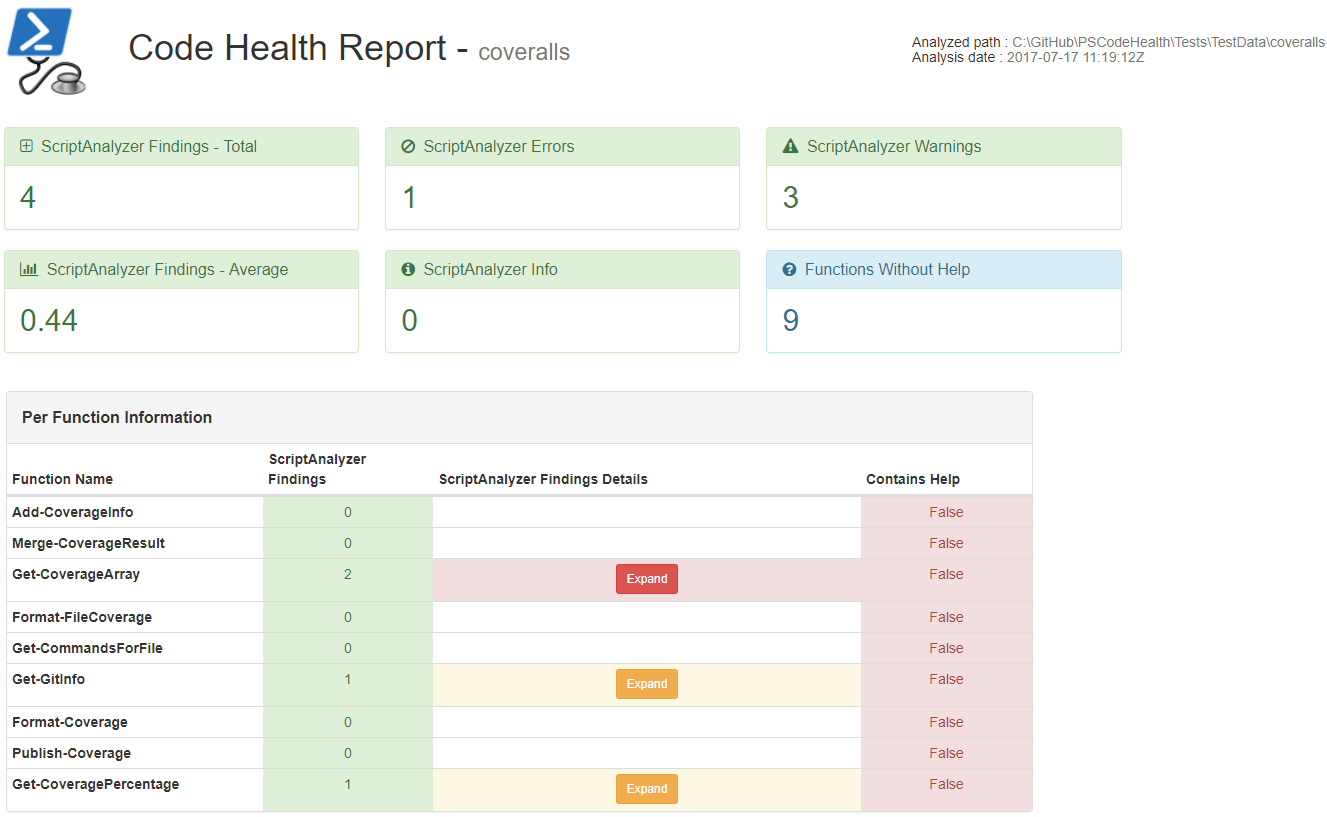
This section focuses on the findings from PSScriptAnalyzer and comment-based help.
For any function which has ScriptAnalyzer findings, the ScriptAnalyzer Findings Details column in the Per Function Information table shows a button.
Again, this button is color-coded. If there is a finding of severity Error, the button is red. If the highest severity in the findings for that particular function is Warning, the button is yellow. If all findings are of severity Information the button is blue.
Clicking this button, collapses the table cell to show the details of the ScriptAnalyzer findings for that particular function.
Clicking the Maintainability link in the sidebar shows the Maintainability section of the report :
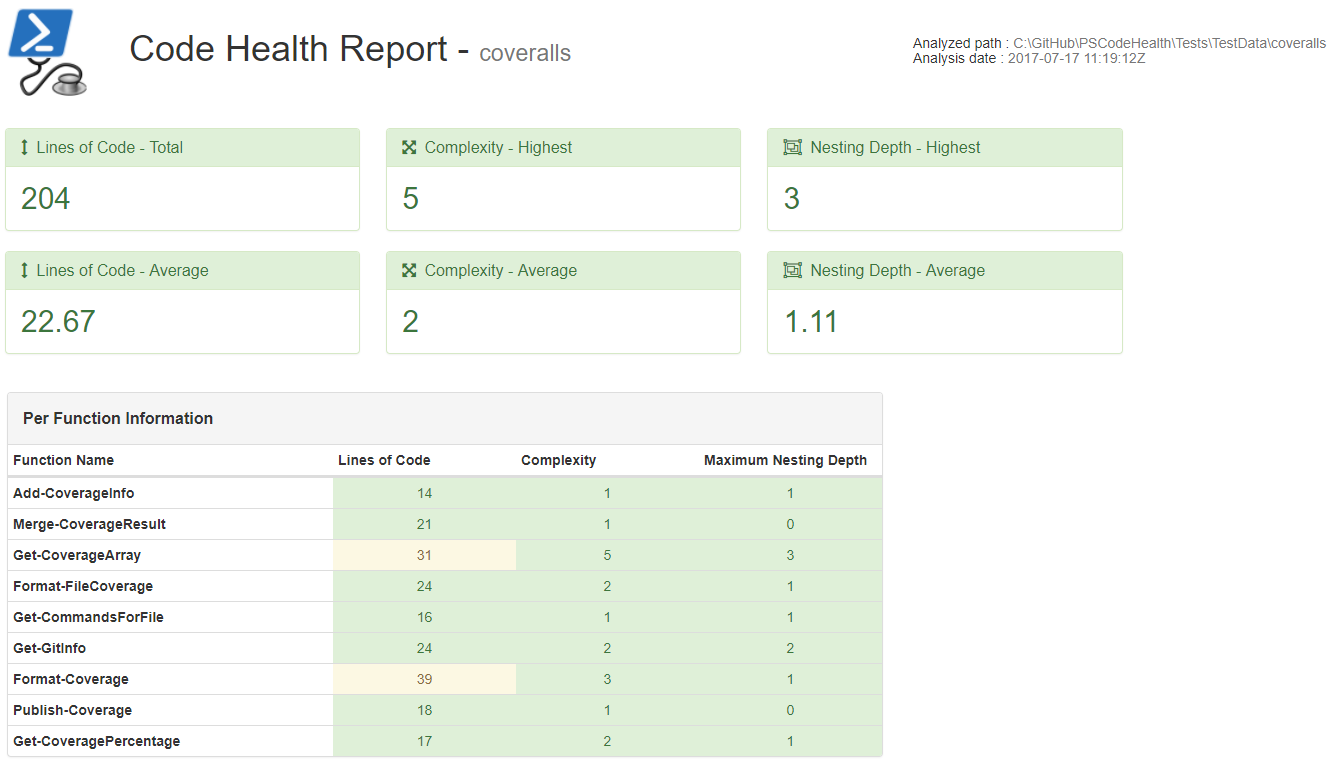
In the above screenshot, only 2 table cells are not green : the Lines of Code column for the functions Get-CoverageArray and Format-Coverage. The yellow-ish styling of these cells indicates a warning : the length of these functions is above the Warning threshold but below the Fail threshold.
Everything else in the above screenshot is a Pass, so overall, the code in this project is fairly easy to understand and maintain.
Clicking the Tests link in the sidebar shows the Tests section of the report :
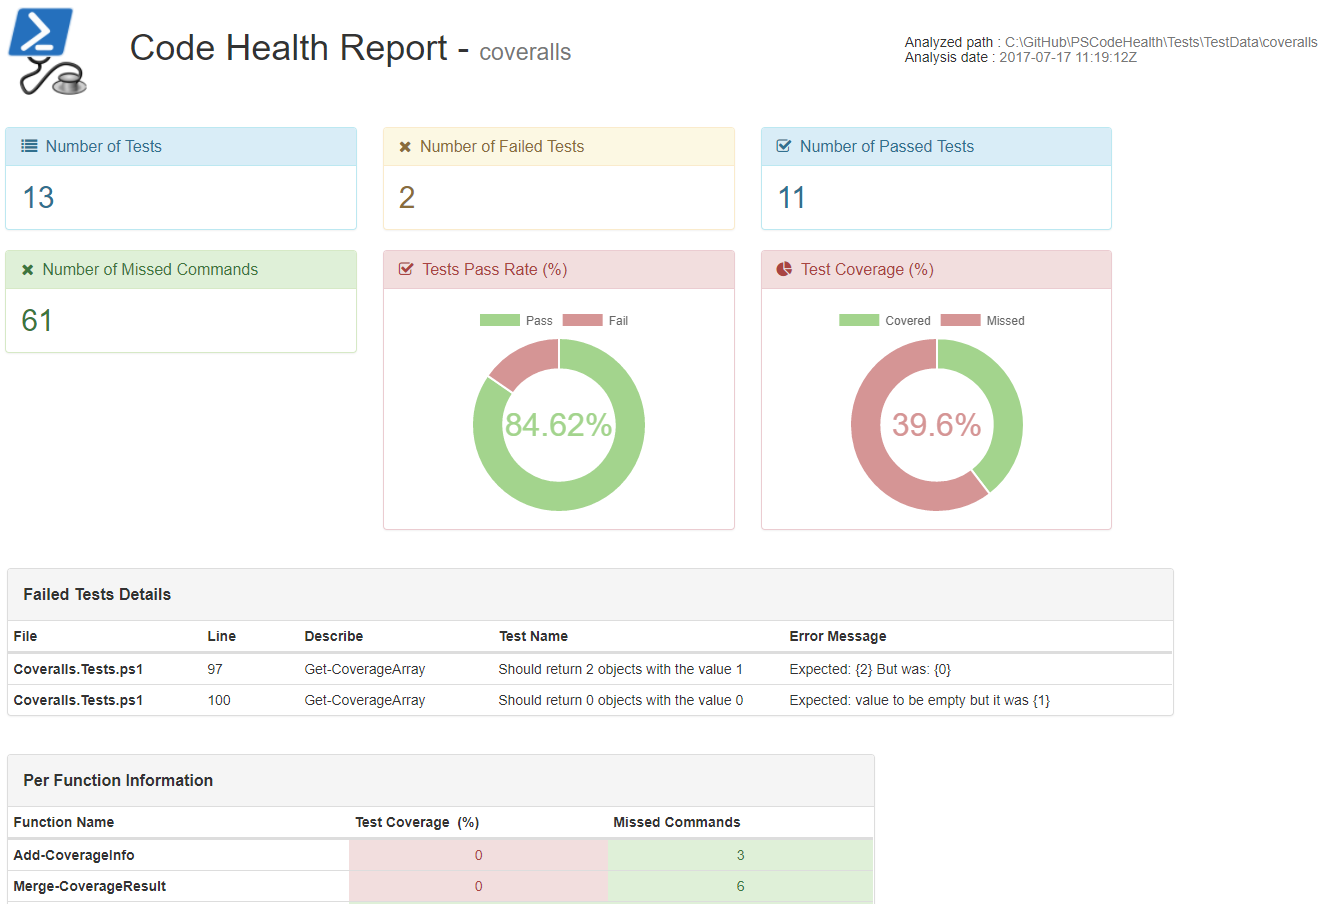
The various panels at the top of this section should be pretty self-explanatory.
The first table provides information on test failures (if any). This should provide an indication on why the test failed, or at least tell where to set a breakpoint to debug the failure.
The table at the bottom of this section provides per-function test coverage information with the same color-coding as the other tables in the report : green for Pass, yellow for Warning and red for Fail.